Hey crypto enthusiasts! Let's chat about Solana, a popular blockchain platform that's been making headlines, but perhaps not for the reasons its supporters would hope for. In the fast-paced world of digital assets, price movements are constant, and right now, Solana (SOL) is facing some significant headwinds.
Many in the market are keeping a close eye on SOL's performance, especially as it shows signs of a potentially troubling chart pattern. If you've been following Solana, you'll know it's experienced a pretty rough patch since mid-September. The network, once a darling of the decentralized finance and NFT spaces, has seen its activity slow down, which often correlates with price pressure.
Let's get straight to the numbers. Solana's price has plummeted a substantial 45% from its September peak, which saw it touch highs of $252.78. To put that in perspective, it's also down a staggering 52.4% from its all-time high. These are significant figures that highlight a considerable correction in the asset's value. While market corrections are a natural part of any investment cycle, the extent and speed of Solana's decline have certainly caught attention.
What's causing this slide? Well, it's a mix of factors, as is often the case in crypto. Broader market sentiment, which has leaned bearish lately, certainly plays a role. When Bitcoin and Ethereum struggle, altcoins like Solana often follow suit, sometimes with amplified movements. However, there's also a specific technical pattern that has analysts buzzing.
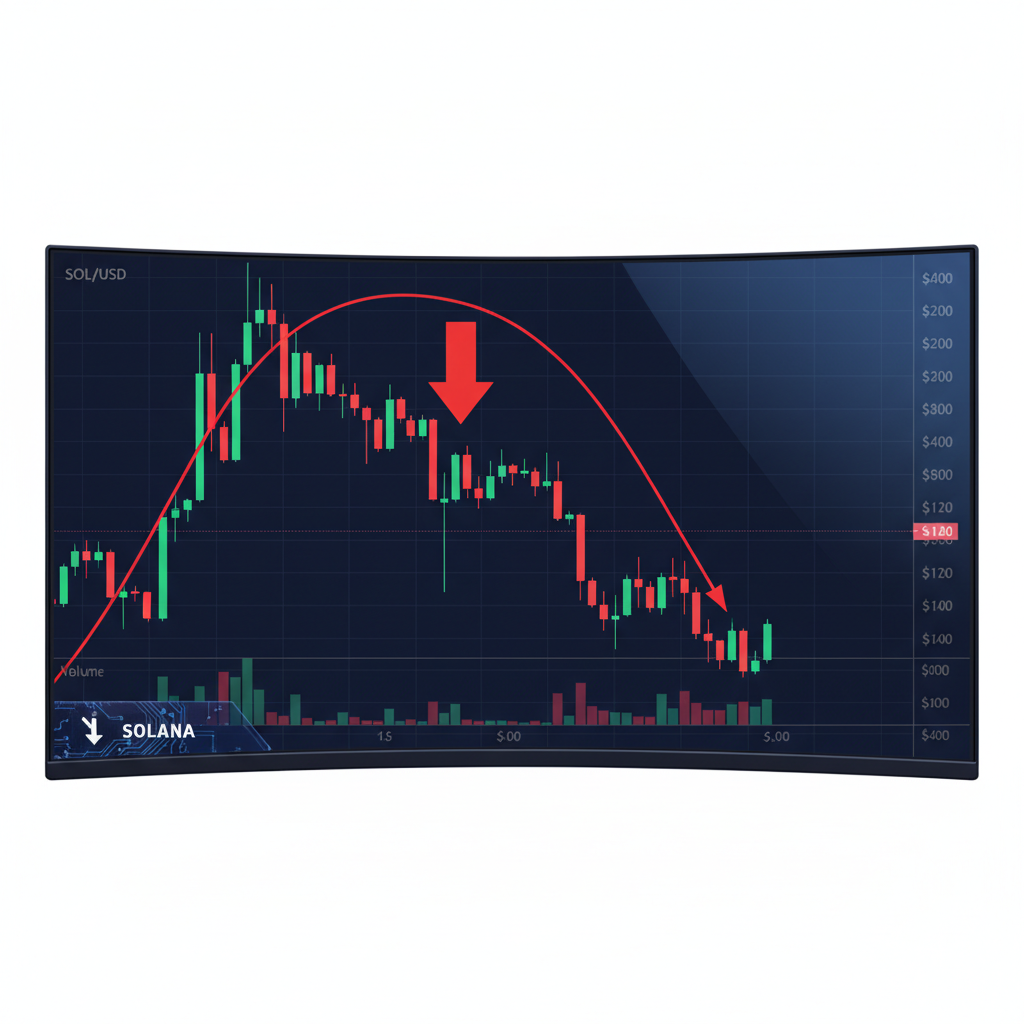
Financial charts can tell us a lot about investor psychology and potential future price action. One pattern that technical analysts are pointing to for Solana is called a 'bearish rounded top.' Now, don't let the jargon intimidate you; it's quite simple to understand.
Imagine a hill. A rounded top pattern typically forms after an asset experiences a strong uptrend, reaching a peak or plateau. Instead of a sharp V-shaped reversal, the price gradually curves downwards, much like the smooth top of a hill. This slow, steady decline after an ascent indicates that buying pressure is weakening and selling pressure is slowly but surely taking over. It's a sign that the bullish momentum has exhausted itself, and a new downtrend could be establishing itself.
For Solana, this pattern suggests that after its impressive run, especially earlier in the year, the enthusiasm has waned, and more investors are looking to offload their holdings than acquire new ones. The 'rounded top' often precedes a more significant downtrend if key support levels are broken.
Beyond the charts, the underlying fundamentals of a blockchain project are crucial. The article points out a slowdown in Solana's network activity. What exactly does this mean, and why is it important?
Network activity refers to things like the number of transactions, active addresses, new projects launching, and the total value locked (TVL) in its DeFi ecosystem. A vibrant, active network is a sign of health and utility. If these metrics start to decline, it can signal several things:
While Solana has had its fair share of network outages in the past, which undoubtedly impacted user confidence, a sustained slowdown in activity can be a more concerning long-term trend. It implies that perhaps the initial hype isn't translating into persistent, organic usage. Of course, a general market downturn can also suppress activity across the board, so it's essential to consider the broader crypto landscape.
The original article suggests that Solana's price risks crashing to $120. This number isn't arbitrary; it represents a significant psychological and technical support level. In technical analysis, support levels are like floors. They are price points where historically, buying interest has been strong enough to prevent further declines. If a strong support level is breached, especially after a bearish pattern like a rounded top, it can signal that sellers are firmly in control and that further, potentially rapid, downside is likely.
A move towards $120 would mean a continued significant correction for Solana, and for many investors, it would represent a fresh wave of concern. Monitoring how the price reacts around this level will be crucial for anyone holding or considering Solana.
While the current outlook for Solana appears challenging, it's important to remember that the crypto market is incredibly dynamic and full of surprises. Bearish patterns and declining network activity are signals, not certainties. Here's a look at what could influence Solana's path forward:
For existing holders, it might be a time for reassessment and considering risk management strategies. For potential investors, it presents a period of increased volatility, which can mean both higher risk and potential entry points if fundamentals improve. Always remember to do your own research and consider your personal financial situation.
Solana's journey has been a rollercoaster, from its meteoric rise to its current challenges. The 'bearish rounded top' pattern combined with slowing network activity paints a picture of caution for the short to medium term. The potential of a drop to $120 is a stark reminder that even promising projects face significant market pressures.
As always, the crypto space requires vigilance and a long-term perspective. Keep an eye on those charts, monitor network developments, and stay informed to navigate these exciting yet unpredictable waters.
.png)